Polarization, regardless of wavelength, is one of the key observables for understanding the solar atmosphere because it provides information about magnetic fields, and microwave polarization is also one of them. It can reveal magnetism in the chromosphere, transition region, and corona from the microwave polarization dependencies of opacity and emissivity related to magnetic fields. Although observing solar polarization in the microwave range is not easy, it has a long history since the early days of solar radio observations (e.g., Tanaka and Kakinuma 1957). Recently, we have published the results of solar microwave polarization obtained with one of the newest “solar” radio telescopes (Atacama Large Millimeter/sub-millimeter Array [ALMA]: Wootten and Thompson 2009) and one of the oldest solar radio telescopes in operation (Nobeyama Radio Polarimeters [NoRP]: Shimojo and Iwai 2023). We present the results in this nugget.
Solar Polarization Observations with ALMA-Band3 (3 mm)
Solar observations with ALMA using the Band3 (3 mm) and Band 6 (1.25 mm) receivers have been offered from ALMA-Cycle 4 [Oct. 2016 – Sep. 2017] (Shimojo et al. 2017, White et al. 2017). After starting solar observations, the development was continued, and then several new functions were offered for solar observations (Band5, Band7, and Regional mapping with the TP-array; Bastian et al. 2023). Based on the results of the commissioning activity for non-solar full-Stokes observations, which was offered since ALMA-Cycle7 [Oct. 2019 – Sep. 2020], we started the development of solar polarization observations in 2019. However, the development did not progress smoothly due to the coronavirus pandemic. Finally, in October 2022, we obtained enough data for the solar polarization commissioning and confirmed the specifications of solar polarization observations. Then, the ALMA observatory has offered solar polarization observations with the Band3 receivers since ALMA-Cycle10 [Oct. 2023 – Sep. 2024].
At first, in the commissioning, we evaluated the effects on polarization observations of the special treatments for observing the Sun and confirmed that the effects are negligibly small. Then, we assessed the pseudo circular-polarization caused by the receivers not being located on the optical axis of the antenna. Figure 1 shows the Stokes-I and V maps of a sunspot and reveals the negative Stokes-V signals with ~1 % at the sunspot clearly. On the other hand, the orange circle in the Field ID#0 Stokes-V map of Figure 1 shows the positive Stokes-V signal with ~0.5 % polarization degrees. However, the signal disappears when the region is in the center of the field (The orange circle in Field ID#45). The positive Stokes-V signal in Field ID#0 is a pseudo signal, and the effect is called “Beam squint.” When you find Stokes-V signals at not the field center in ALMA Stokes-V maps, you should consider the effect. Fortunately, the amplitude of the pseudo signal is the same as that evaluated in non-solar observations and can be predicted (Hull et al. 2020).
Since ALMA is not dedicated for observing the Sun, there are several limitations for solar observations with ALMA. Nevertheless, we hope that solar polarization observations with ALMA enhance our understanding of magnetism in the solar atmosphere.
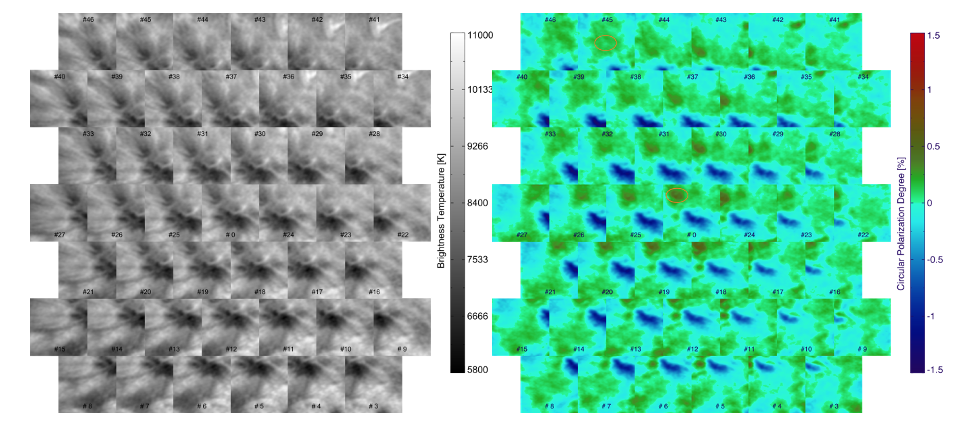
Figure 1 The Stokes-I maps (left) and circular polarization degree maps (right) of the sunspot obtained from the short-spacing MOSAIC observation. The number indicates the Field ID. Note: solar polarization observations with MOSAIC are not offered in Cycle10.
Relationship of solar microwave fluxes and its polarization to the other solar indices
In Japan, we have an over 70-years history of monitoring total solar fluxes with microwaves at Toyokawa and Nobeyama (Tanaka et al. 1953). The datasets include the circular polarization degrees, and the data since June 1994 are provided using the FITS format (Shimojo and Iwai 2023). We used the FITS database and compared microwave fluxes and its polarization degrees with the other solar indices (sunspot number, X-ray, magnetic flux, EUV, Ca II plage, Mg II index) for understanding solar and stellar microwave data. In this nugget, we focus on the polarization data.
At nonflaring periods, Stokes-V signals with a few GHz come from above sunspots, and the signals are produced by gyro-resonance emission at strong magnetic field regions above the radio photosphere (e.g., White and Kundu 1997). The left panels (a – f) in Figure 2 show the time profiles of some solar indices during an active region with strong preceding sunspots passing from east to west limbs. As expected, when the active region appeared from east limb, the sunspot number, X-ray and microwave fluxes were increasing, and the microwave Stokes-V polarization degree was decreasing due to gyro-resonance emission from the preceding sunspots with negative magnetic polarity. From the results, we can predict a positive correlation between the microwave polarization degree and the signed total magnetic flux of the Sun. However, it is not real (Panel h, Figure 2). As you know, there are sunspots in both hemispheres and the polarization is reduced by each other.
Recently, the existence of huge starspots produced super flares on stars and their evolution is revealed from Kepler data (Namekata et al. 2020). Unfortunately, it is hard to reveal the magnetic configuration of such starspots (with single/multiple polarity) from optical amplitude variations. However, when we observe stellar microwave flux and its polarization, we can guess the magnetic configuration based on our solar knowledge. For simple examples, both the microwave flux and amplitude of its polarization degree increases when the active region has a huge monolithic sunspot. On the other hand, when the active region with the multiple starspots with both polarities appears, the microwave flux is increasing but the polarization degree does not change. In the SKA and ngVLA era, we would be able to detect thermal emission (free-free and gyro-resonance) with a few GHz and its polarization from stars more easily. Forwarding the era, it is important to summarize the solar microwave data obtained during multiple solar cycles.
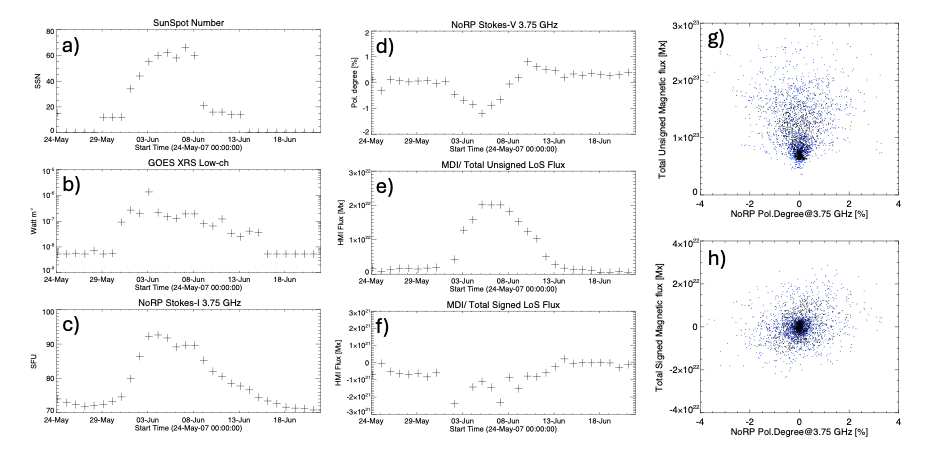
Figure2 a) – f) The time profiles of the solar indices during NOAA10960 passing the solar disk. g) — h) The scatter plots between 3.75 GHz polarization degrees and the total unsigned g) or signed h) magnetic fluxes during 1995-2000.
This nugget is based on the recent article: Shimojo, M., Bastian, T.S., Kameno, S. et al. Observing the Sun with the Atacama Large Millimeter/Submillimeter Array (ALMA): Polarization Observations at 3 mm, 2024, Sol Phys 299, 20. DOI: 10.1007/s11207-024-02265-3
References
- Tanaka, H. and Kakinuma, T. 1957, of the Res. Inst. of Atmospherics, Nagoya Univ., 4, 60
- Wootten, A. and Thompson, A.R. 2009, IEEE 97(8), 1463
- Shimojo, M. and Iwai, K. 2023 Geoscience Data Journal, 10, 114
- Shimojo, M. et al. 2017 Solar Physics, 292, 87
- White, S. et al. 2017 Solar Physics, 292, 88
- Bastian, T.S. et al. 2023 Astron. Space Sci. 9:977368
- Hull et al. 2020 Astron. Soc. Pac. 132, 094501
- Tanaka, H. et al. 1953, of the Res. Inst. of Atmospherics, Nagoya Univ., 1, 71
- White, S. and Kundu, M. 1997, Solar Physics, 173, 31
- Namekata, K. et al. 2020 ApJ, 891, 103